What if public transport could be made much more accessible at no extra cost?
Read on to find out how we create adaptive bus routes that could transport more passengers while making considerable profits without invading the passenger’s privacy!
Problem Statement
Transformation of public transport by using web or service applications to elevate user motivation
India is home to a large population of people. You require a medium of transportation to move from one place to another. In India, the majority of people rely on their personal transport. Hence, this leads to roads congestions, various types of pollution, etc. You are provided with the benefits of public transportation. Your task is to build an application that must encourage people to use public transportation systems.
The team
- Chinmay Hebbar - Backend developer
- Manan Soni - ML developer
- Siddharth Singh - App developer / ML developer
- Sparsh Jain - Frontend developer
Our Solution
We designed Genetic Algorithms that could dynamically create bus routes that would cater to the needs of the majority of people while being time and cost-effective.
Modelling the problem
- The problem is modelled using Graphs.
- Each bus station is a node on the graph and an edge between two nodes represents the distance between these 2 nodes (bus stations).
- For simplicity, we clip large distances, i.e. 2 bus stations are connected if the distance between them is less than R
Setting the objectives
We monitor 3 goals while evaluating our model:
- How much of the total capacity of each bus is fulfilled (in %)
- How many (simulated) citizens were our buses able to transport
- The total length of all the routes
Gathering Data
Surprisingly, we required almost no data about the users themselves. All we required was the total number of people that arrived and departed at each bus stop at the end of each day.
No privacy concerns here!
Simulating the population
Assume that we have N bus stops and a population of P passengers.
For a given bus stop ‘i’, let: \(D_i: \textrm{Total number of passengers that left station } \: S_i \\ A_i: \textrm{Total number of passengers that arrived at station} \: S_i\)
- Using these we generate probabilities of arrival and departure \(\textrm{Probability of departure from station i: } \: \frac{D_i}{\sum_{i=1}^{N}D_i} \\ \textrm{Probability of arrival at station i: } \: \frac{A_i}{\sum_{u=1}^{N}A_i} \\\)
- Finally, we sample P independent values from these distributions to get a sample population.
Step 1 - Looking for viable bus stops
- Since, typically, a city may have a large number of bus stations, it would be challenging to process data related to all the bus stops at once. So we resorted to finding an approximation.
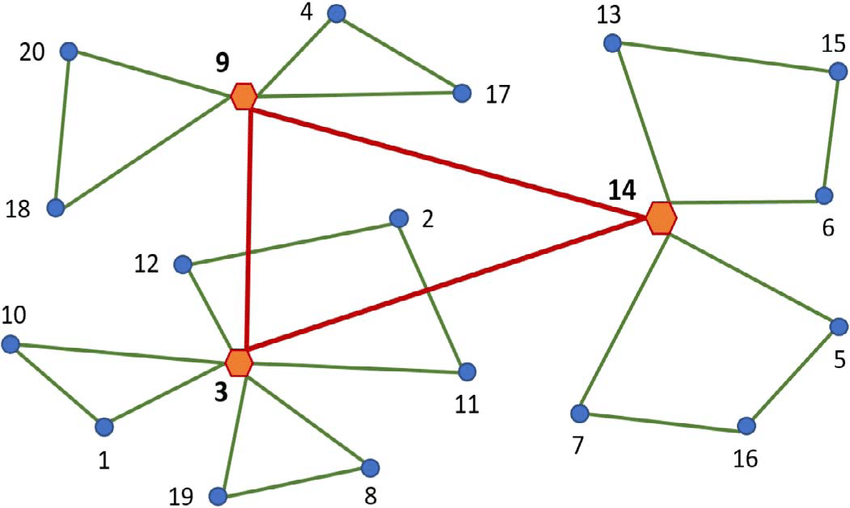
- We look for K bus stops among all the candidates such that the total distance between any bus stop and one of these K stops is minimum.
- Mainly, we are looking for bus stations that could act as hubs. Since covering all the stops is not possible, our buses pass through ‘primary’ stops and passengers can then move to the ‘secondary’ bus stops on their own.
- In graph theory, this problem is known as the Capacitated facility location problem

Example solution (N=20, K=3): Here the red nodes representing ‘primary’ bus stops
Step 2 - Establishing a map for bus routes
- We construct a second graph consisting with K bus stops as vertices. Each edge represents the distance between the corresponding vertices.
- The graph is fully connected, i.e. each of these K bus stops is connected to the rest of the K-1 bus stops.
- Additionally, each vertex also stores the arrival and departure probabilities.
- This graph will act as our central dataset, we will look for bus routes on this graph.
Step 3 - Finding optimal bus routes
- We train a Genetic algorithm to decide on the optimal routes.
- Each member of the GA population consists of a set of bus routes along with the number of buses running on each route.
- The fitness function is calculated by sampling a passenger population using the arrival and departure probabilities. * Then we use these simulated passengers to calculate our objectives - utilization of buses, profits and number of people served.
- Finally the fitness function is calculated by taking a linear combination of the 3 given goals. More details about the Genetic Algorithm’s architecture can be found on our Github repository.
Outcomes
We designed three separate solutions and compared them to the original routes.
- Original: The routes given in the original dataset
- Profits recorded: - 15,500 Rs
- Number of people served: 1136 using 164 buses
- Economical: The model tries to find routes which optimize only the total revenue
- Profits recorded: 1,12,446 Rs
- Number of people served: 650 (-42% utilization) using 51 buses
- People-centric: Optimize the model, so the maximum number of people can commute without considering the revenue
- Profits recorded: 2202 Rs
- Number of people served: 3374 (197% utilization) using 74 buses
- Resource centric: The model tries to efficiently utilize all the resources in hand - It’s objective is somewhere between that of model 1 and model 2
- Profits recorded: 87000 Rs
- Number of people served: 2000 (76% utilization) using 65 buses
You can clearly see a considerable increase in the utilization of buses and profits.
For example, the routes generated by the resource-centric model serve 76% more people while making 4x profits compared to the original routes given in the dataset.